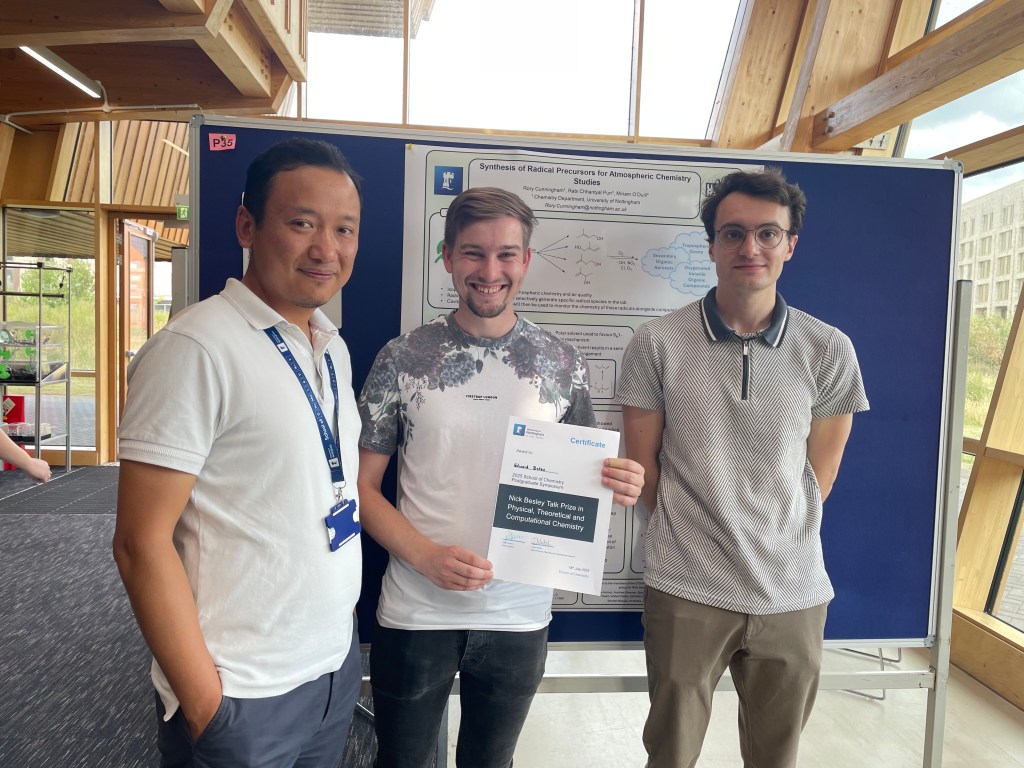
The annual UoN School of Chemistry PGR symposium took place in mid July. Ed presented a talk and Rory presented a poster. Ed’s presentation was awarded the best talk within the physical section!
The annual UoN School of Chemistry PGR symposium took place in mid July. Ed presented a talk and Rory presented a poster. Ed’s presentation was awarded the best talk within the physical section!
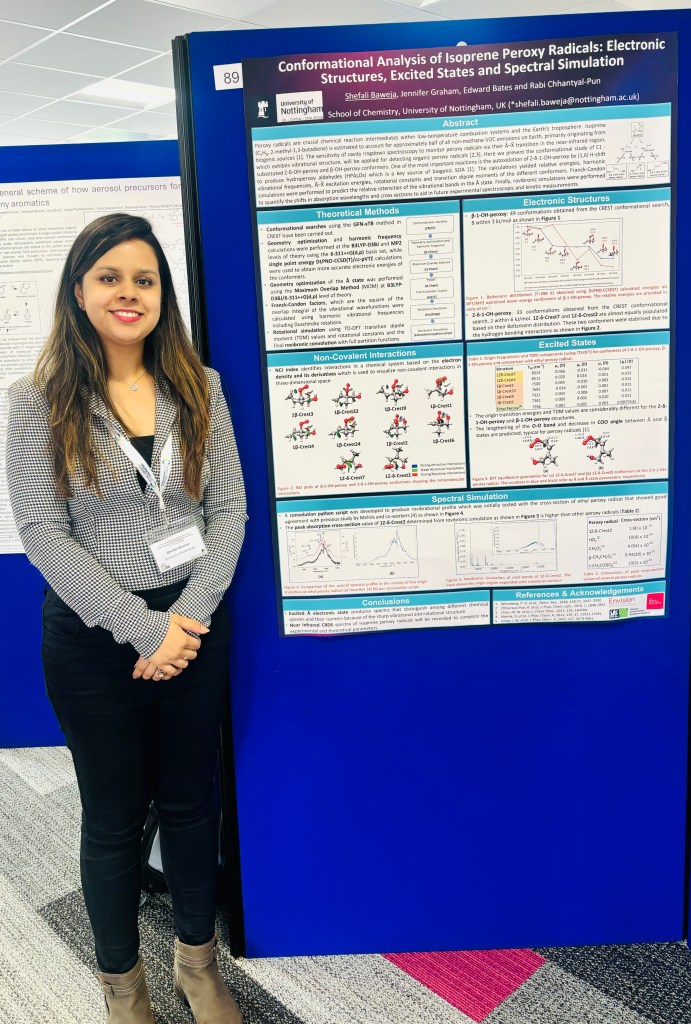
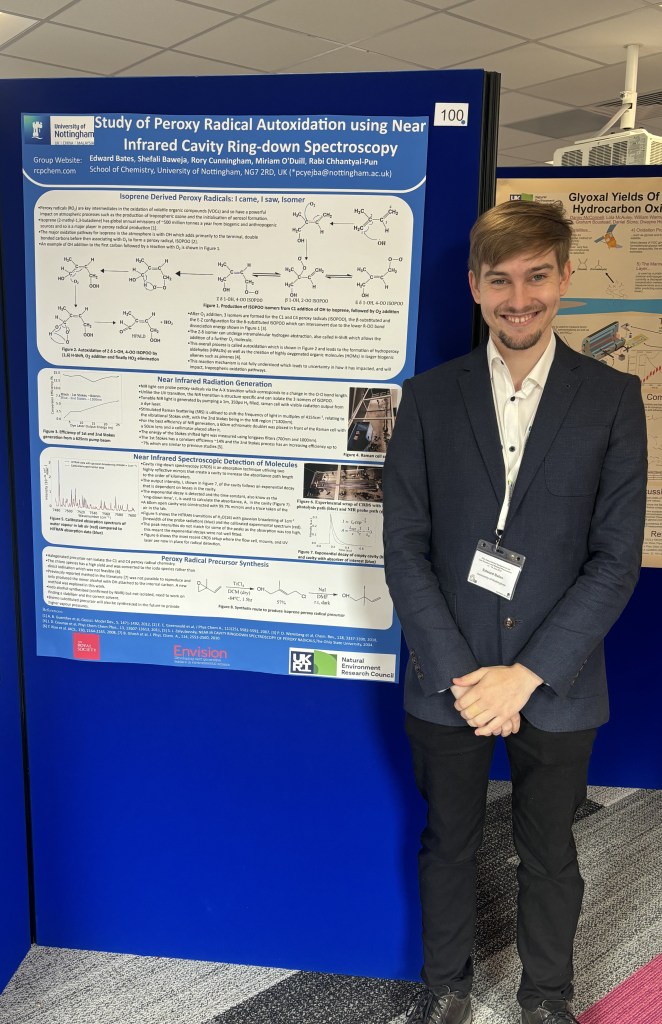
The group attended the 27th International Symposium on Gas Kinetics and Related Phenomena held at the University of Leeds in July 2024. Ed, Shefali and Rabi presented posters on Peroxy radical spectroscopy, Cavity Ring-down apparatus development and Criegee intermediate chemistry. Lot of useful meetings with eminent researchers, collaborators and other new researchers in the field.
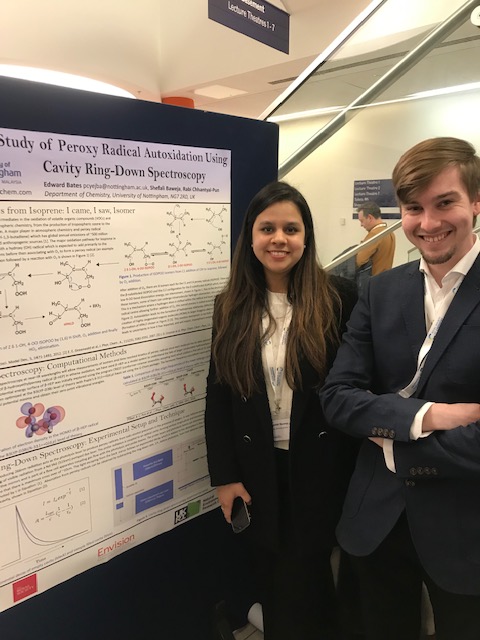
The group attended the Faraday Joint Interest Group Conference held in Sheffield in April 2023. Ed, along with Shefali, presented the first poster of the group at this conference!
Python is a popular programming language in sciences, engineering and social sciences to analyze data. It is also a popular scripting language in web application and computer-aided design communities. Python is a great first programming language to learn as the programming syntax are easily readable. It is also freely available and there are loads of learning materials in YouTube, GitHub, stack overflow etc.
RCP has partnered with a local charitable organization, DigiLocal, to create a project guide for introducing young people to data analysis using Python. DigiLcoal organizes free technology clubs in various under-represented communities around Bristol for their young people to promote problem solving skills and resilience within a friendly environment: https://digilocal.org.uk/about-us/

The project guide uses Jupyter notebook for analyzing air quality data set maintained by Department of Environment, Food and Rural Affairs (DEFRA). Young people are guided through processing NO2 measurement data set obtained from London and Bristol, before and after the COVID-19 pandemic, using pandas module. Through simple statistical analysis (average and standard deviation) using NumPy module, they can find out whether the pandemic has resulted in any change in air quality of these two cities. They are also guided to visualize their analysis through simple plotting using matplotlib module. The guide should also prepare them to analyze seasonal dependence of NO2 concentration in the two cities as an independent challenge! The guide, Jupyter notebook and the datasets are uploaded in a repository linked here: https://github.com/rc13564/Digilocal_AirWeBreathe

This guide could be easily modified to include air pollution measurements from various areas of interest within the UK. All materials are free to use for non-profit purposes.
Kinetic phenomena are ubiquitous in science and engineering research. A nice introduction to chemical kinetics is presented in this wikipedia page. Modelling kinetic systems involves solving set of coupled ordinary differential equation either analytically, for small systems, or numerically, for large systems. Scientific experiments under controlled environment are able to isolate various kinetic pathways and thus can be modeled analytically. However, most systems in reality, such as chemical reactions in the atmosphere, are relatively large and numerical integration need to be performed.
We have created a Python based program, NumKinFit, which can perform numerical integrations for kinetic systems and also fit the model parameters to experimental measurements. The program along with a manual with few examples are available in a GitHub repository linked here.

NumKinFit is free to use and distribute for non profit use. The GUI can be run in Windows OS without any Python installation. This program can be used for analyzing kinetic measurements in research laboratories and also as a tool to introduce kinetic modelling to undergraduate students.
After the successful colorimetry outreach in Kathmandu last year, RCP was back in Kathmandu this year too (October 2019) for another outreach event. Similar to the last year, RCP brought the colorimeter kits from the University of Bristol, UK. However, this year the colorimeter instruments were purchased using the Natural Environmental Research Council grant NE/P013104/1 pathways to impact fund with the aim of providing them to Kathmandu University on a long-term loan. A training program was organised to familiarize lecturers from the School of Chemical Science and Engineering, Kathmandu University (KU), with the colorimeter instrument. The training involved explanation of the Beer’s law principle, linearity of calibration curves, use of the instrument and possible activities with the school students.
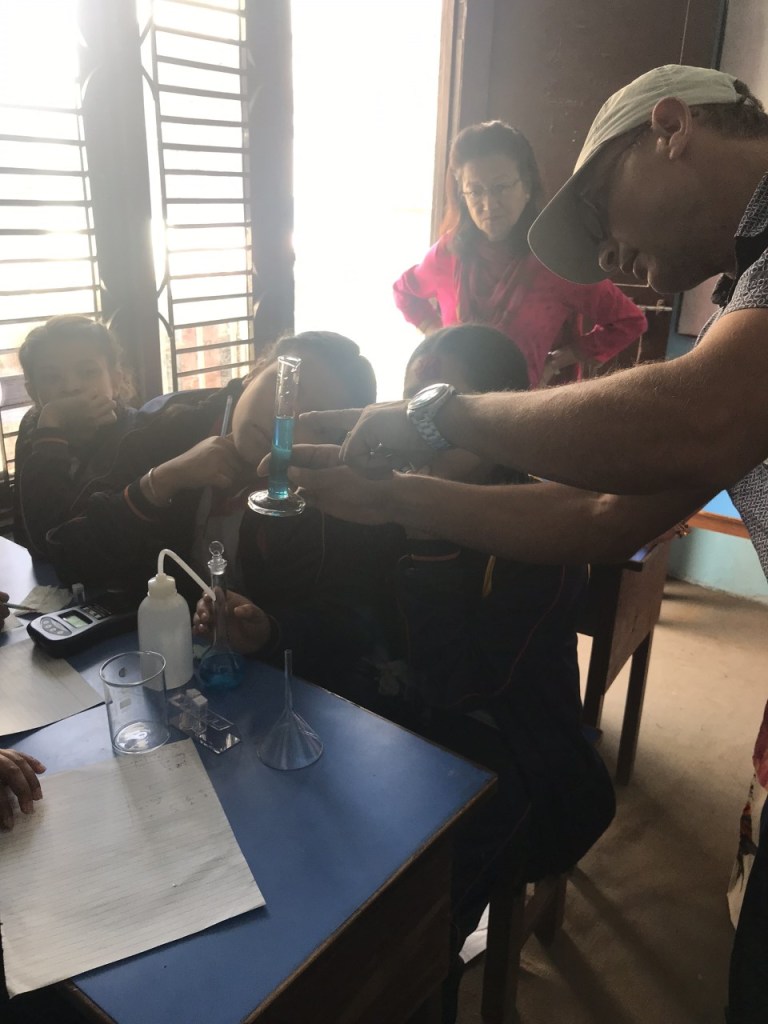
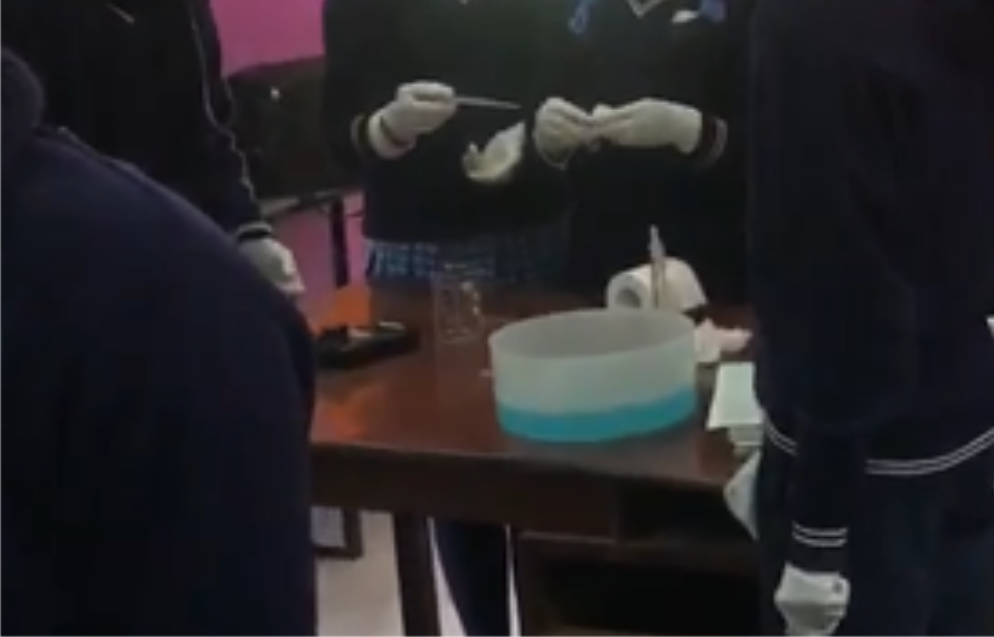
The initial training was followed by experiments along with grade 10 students from Loyola secondary school in Purano Baneshwor, Kathmandu. Four lecturers lead groups of 5 to 7 students with a set of experimental kits involving a colorimeter, copper sulfate solution, glassware and distilled water for dilution. Each group were explained principles of dilution, Beer’s law and were asked to measure absorbance of 3 to 4 diluted solutions using red, blue and green LEDs in the colorimeter. The students were then asked to plot the absorbance measurements as a function of the diluted concentrations to obtain a calibration curve. All the groups obtained a straight calibration curve! They were explained importance of the calibration curve and how it could be used to measure concentration of copper sulfate in the field measurements. The main aim of this year’s event was to make the lecturers at Kathmandu University proficient in using the colorimeter instrument and independently organize outreach events in future in secondary schools across Kathmandu.

RCP was interviewed by a local TV program ‘Open Mic’ regarding the outreach program and here is a video link:
Nepal is a landlocked developing country in south Asia between China and India. It is home to 25 million people of various ethnicities including Gurkhas and Sherpas, and to the tallest mountain range in the world. The Bristol ChemLabS outreach was performed at the Loyola Secondary School in Kathmandu, in collaboration with the Department of Chemical Science and Engineering at Kathmandu University (KU). The outreach event was sponsored through the United Kingdom’s Natural Environmental Research Council grant NE/P013104/1 impact fund. A colorimeter experiment was selected based on the its applications of principles in physics, chemistry and mathematics. Also, the colorimeter instruments are portable, and the chemicals/glassware needed are readily available.


Secondary school students from Grade 9, 10, and 12 participated in the outreach events held on two separate days in November 2018. An introductory presentation was given at the beginning of each day describing my research, the colorimeter experiment and how the two are related. Grade 10 students prepared standards of various concentrations of copper sulphate solutions using serial dilutions and measured absorbance of red light using the colorimeter. The standard solutions of copper sulphate and methylene blue had been prepared at KU in Dr. Bhim Kafle’s laboratory. Grade 9 students measured absorbance of a copper sulphate solution of “unknown” concentration. Both grades had been divided into 4 groups of about 5 students each. The students then collaborated to make calibration curve for the copper sulphate solution using a graph paper and then used it to find the “unknown” concentration. On a separate day, grade 12 students performed similar measurements of methylene blue solutions using the red, blue and green colours of the colorimeter. On both days the group with the best measurement for the unknown concentration were acknowledged at a concluding ceremony at the end of the day. Around 80 students, two school teachers, two faculty members and two master’s students from Kathmandu University participated in the outreach events.


The outreach event was also covered by a local blog website linked here: https://www.setopati.com/kinmel/others/170640?fbclid=IwAR0cTlZi3GXxl_TJG2ElAEdu7JL0ZPwpZUDbxjES2AMBahTO4pP7V3h_KBI
